
In the recent update of the Real Estate Valuation (WOZ), notable shifts have been observed in both the largest cities and in more rural municipalities. Metropolitan areas, which historically experienced rapid increases in value, are now experiencing a marked decline, while less populated areas are actually increasing in value. This is evident from our data of WOZ values from 2023 compared to a year earlier.
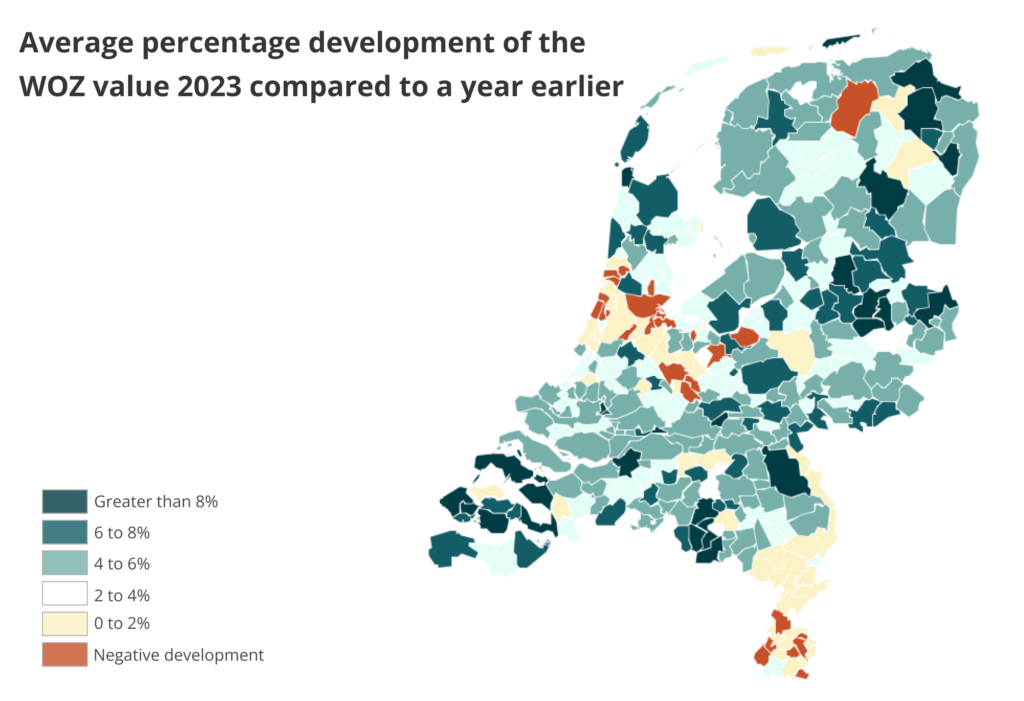
Amsterdam and surrounding areas show the largest decline. Specifically, there is a significant depreciation in Amsterdam itself and in adjacent areas such as Amersfoort, Heemstede and Beverwijk. This pattern is also visible in parts of the provinces of Utrecht and Haarlem.
The province of Limburg shows a general decline in WOZ value, with the exception of a few municipalities. This contrasts sharply with the provinces of North Brabant and Gelderland, where no such declines are observed, indicating regionally specific dynamics.
Largest value increase in less urban areas
Interestingly, the value increase can mainly be seen in less urban areas. These increases are visible in parts of North Brabant, where municipalities around Eindhoven and Den Bosch are rising or falling less rapidly, while the surrounding smaller municipalities are actually increasing in value.
Top risers and fallers
The five municipalities with the largest increases:
- Midden-Groningen: 14.29% increase
- Veere: 13.53% increase
- Capelle aan den IJssel: 13.37% increase
- Gorinchem: 11.68% increase
- Schouwen-Duiveland: 11.03% increase
The five municipalities with the largest decreases are:
- Amsterdam: 3.43% decrease
- Amersfoort: 2.84% decrease
- Heemstede: 2.20% decrease
- Meerssen: 2.19% decrease
- Beverwijk: 1.86% decrease
“These shifts in WOZ values may reflect a broader trend in which the housing market in the largest cities is cooling down, while less densely populated areas are becoming more attractive as places to live. This could indicate the shift in housing preferences that has arisen during the COVID period,” says Luke Liplijn.
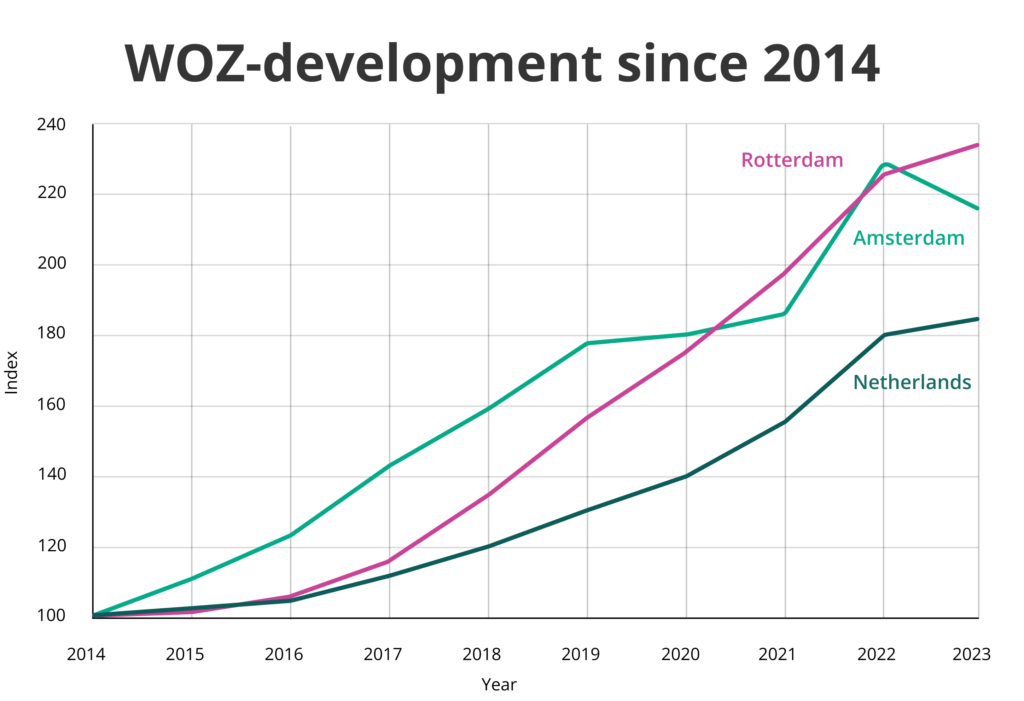
“Rotterdam is known for its large price differences on the housing market, ranging from affordable options to luxurious accommodations. This diversity may have made Rotterdam more attractive to knowledge workers during the pandemic, especially given that they were previously mainly based in expensive housing in Amsterdam. The flexibility that hybrid working entailed offered them the opportunity to choose a home that better suits their budget and living preferences.”
About the research
The analysis only included homes that had a WOZ value in both 2022 and 2023. The outliers have been removed, which means that extremely high or low WOZ values have been ignored in the analysis.
Municipalities with insufficient coverage are also excluded. Only municipalities in which at least 80% of the homes have received WOZ values for both this year and last year are included in the analysis.
Map: Average percentual development of WOZ value 2023 as opposed to a year before. (Dutch only)