Sustainable Roofs Opportunity Map: Where data and sustainability come together at new heigts

An interview with Jan Henk Tigelaar, Director at Rooftop Revolution
Image: Alice Wielinga on behalf of Rooftop Revolution
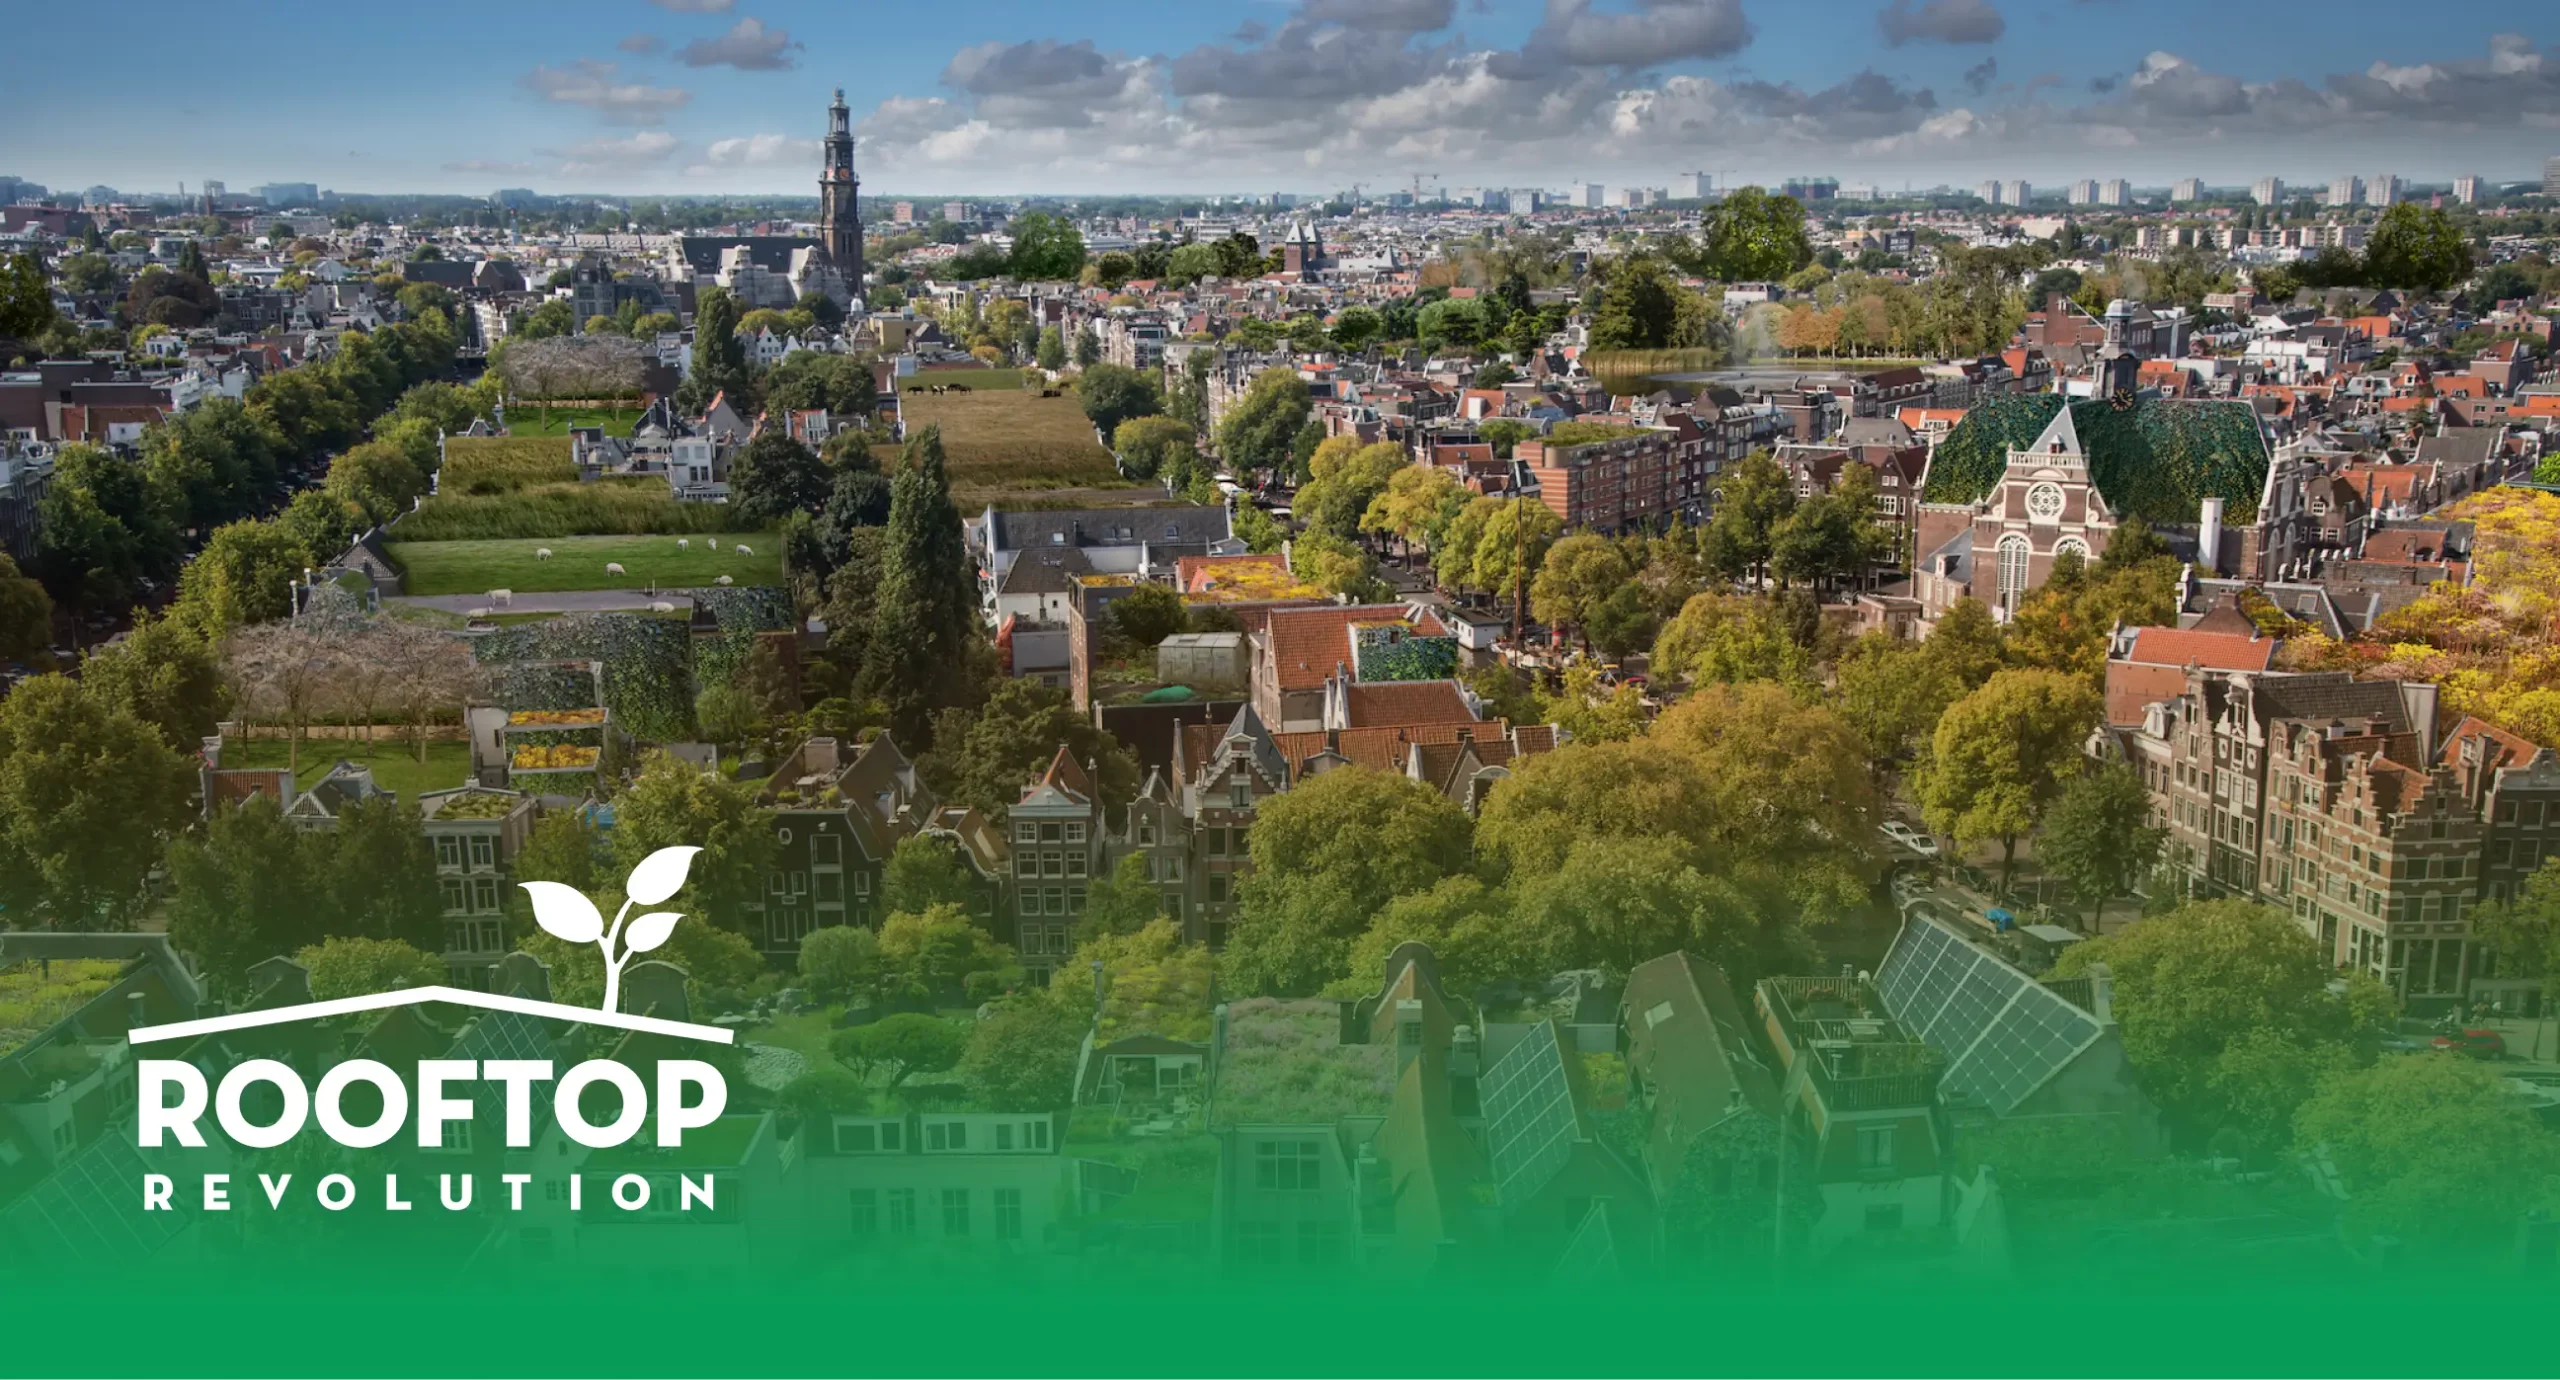
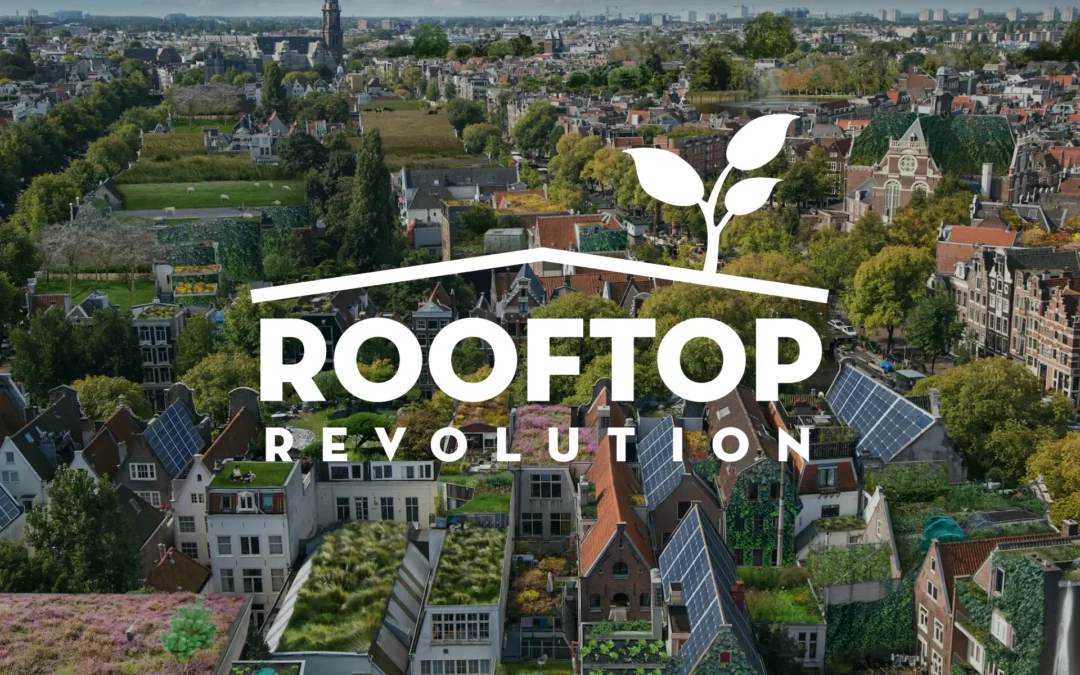
In the middle of the concrete jungle of Amsterdam, Rooftop Revolution has undertaken an exciting mission to create green oases in an unexpected place: rooftops! Their goal is to transform the unused rooftop space in the Netherlands, equivalent to 60.000 football fields, into vibrant green spaces. In an interview with Jan Henk Tigelaar, Director at Rooftop Revolution, we dive into the origin and impact of the Sustainable Roofs Opportunity Map, where data and sustainability seamlessly come together.

Jan Henk Tigelaar
Director
Challenge
Jan Henk begins, “In our ambition to realize sustainable rooftops we needed concrete insights into its possibilities. We needed factual figures and predictions to measure the impact of sustainable roof use. Therefore, we had discussions with various parties, including Matrixian.”
While Rooftop Revolution had previously “put together a few maps” to visualize the potential of sustainable roofing they realized the importance of concrete figures and predictions for their mission. The challenge was to find a partner specialized in data to provide the insights needed to make their ambition a reality. “We chose Matrixian because they fully embraced our vision. And it was a pleasure to work with them. There has always been (and still is) room to exchange ideas in an informal way, and they always go the extra mile when needed.”
Approach
During the collaboration a mutually beneficial relationship developed, with Rooftop Revolution combining its expertise in sustainability with Matrixian’s skills in data processing and analytics. The result was the Duurzame Daken Kansenkaart. This digital map of the Netherlands shows per rooftop the most feasible and profitable sustainable uses.
The map was created by integrating various datasets. Building characteristics, such as height, roof type, and construction year, were matched with environmental factors like water levels (after rainfall), the level of heat stress, and sunlight exposure. Modeling this data added value because it made it possible to calculate the best use for each roof. For example, a modern flat roof in a water-stressed area is perfect for a green roof with water-retaining capabilities, while an older sloping roof with ample sunlight exposure is ideal for solar panels.
Result
The Sustainable Roofs Opportunity Map has become a powerful instrument embraced by both governmental bodies and real estate entities. “With this map we can showcase the most suitable sustainable use for each rooftop, backed by facts and figures. We can do this for an entire region or a specific real estate portfolio.” The map has positioned Rooftop Revolution as a frontrunner in utilizing data for rooftop utilization, empowering them to support other entities striving for sustainability.
Jan Henk elaborates: “We have employed the map for the Municipality of Utrecht, Municipality of Amsterdam, Housing Corporation Havensteder, Province of Utrecht, and the State Property Agency. It’s an impressive list that we take pride in, and there are also exciting new projects on the horizon, so stay tuned,” Jan Henk chuckles.

