Since 2015, home owners are obliged to state the energy label when delivering, selling or renting out a house. This gives buyers and new tenants better insight into the energy efficiency of a house and an indication of the energy bill. We wondered to what extent this affects the market value and delved into the data to find out.
Energy label
The introduction of the energy label indicates how energy-efficient a house is. The least efficient houses are given the G label and the most economical the A++++ label. This has to do, for example, with sustainability features such as insulation of a home, double glazing or solar panels. The European Union has introduced this energy labeling system as part of its goal to make the housing stock greener.
Research
The price effect was investigated using a linear regression analysis, controlled for construction period, living space and housing type. All transactions in 2021 that were provided with an energy label were examined. Additionally, outliers haven’t been considered, such as houses worth more than € 5 million.
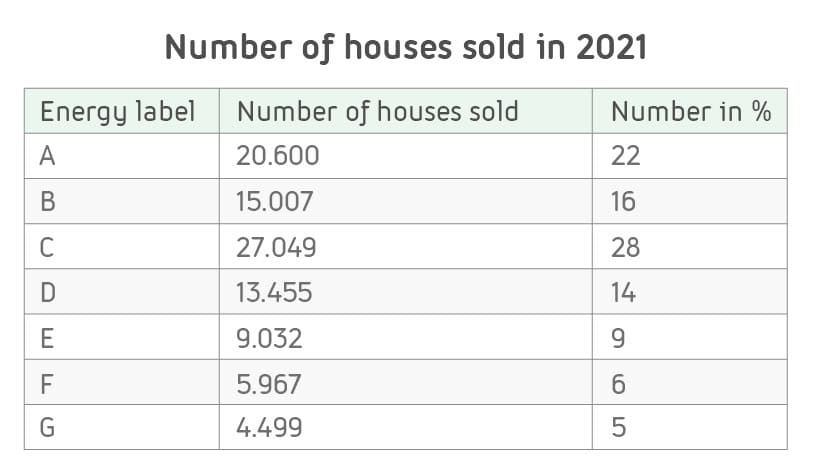
The table below shows how many houses were sold per energy label in 2021. It appears that more than half of the houses had an A, B, or C label. Given the small number of houses with energy labels F and G, these results should be interpreted carefully.
Would you like detailed energy label information for homes in the Netherlands?

Result
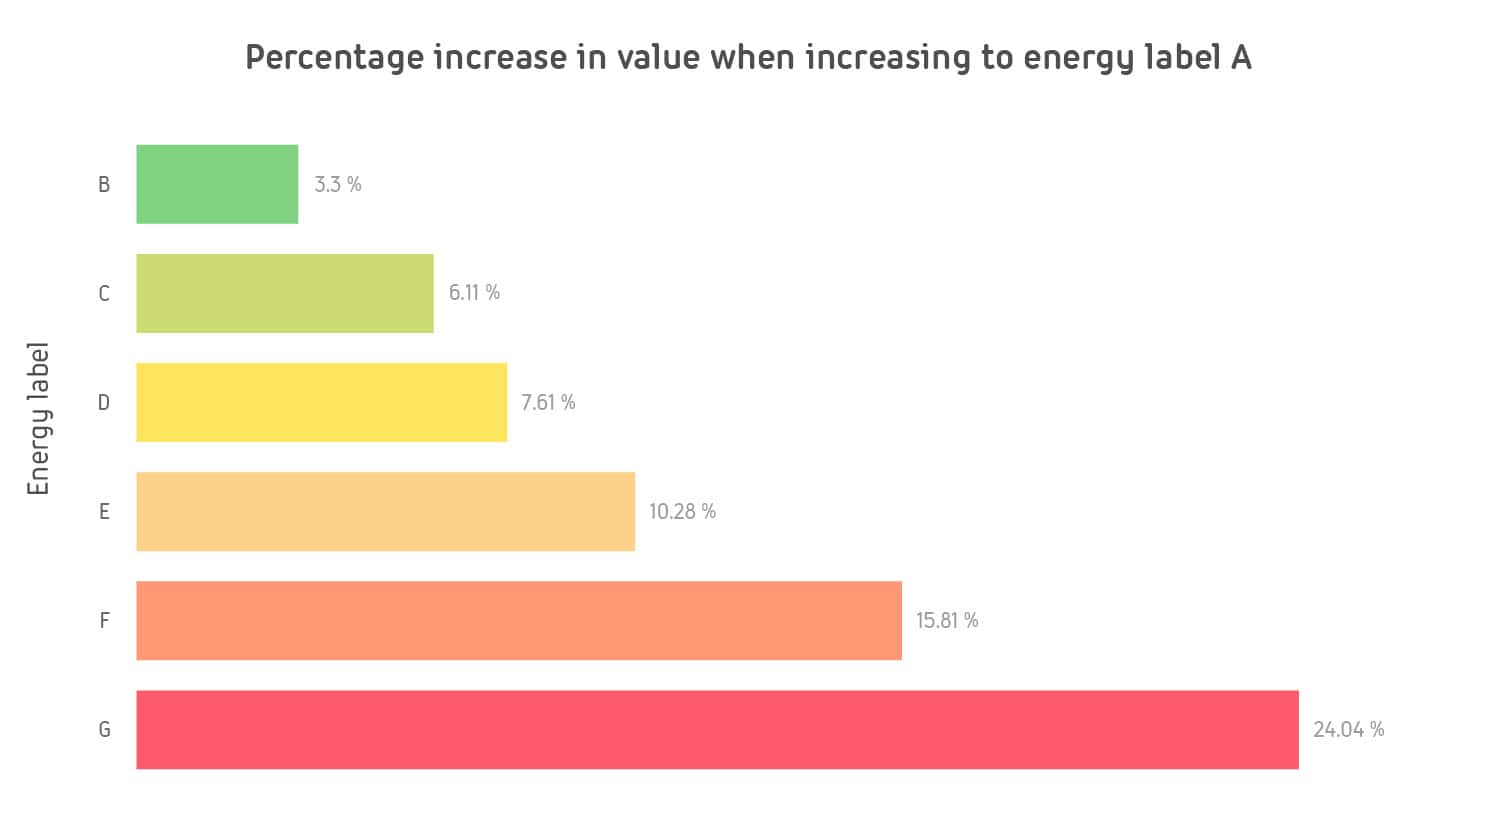
For the whole of the Netherlands, we find that raising an energy label has a positive effect on the value of the house. The average value increases by 3.3 percent when a label is changed from B to A. As an example, if a house is worth € 300.000 and has an energy label B, it will be worth € 309.900 once it has been upgraded to energy label A. If a house changes from energy label G to A, this will increase the value on average by 24.4 %, or € 72,000. However, it should be mentioned that the general appearance and condition of the house (probably) also plays a role in the value increase.

Major differences per location
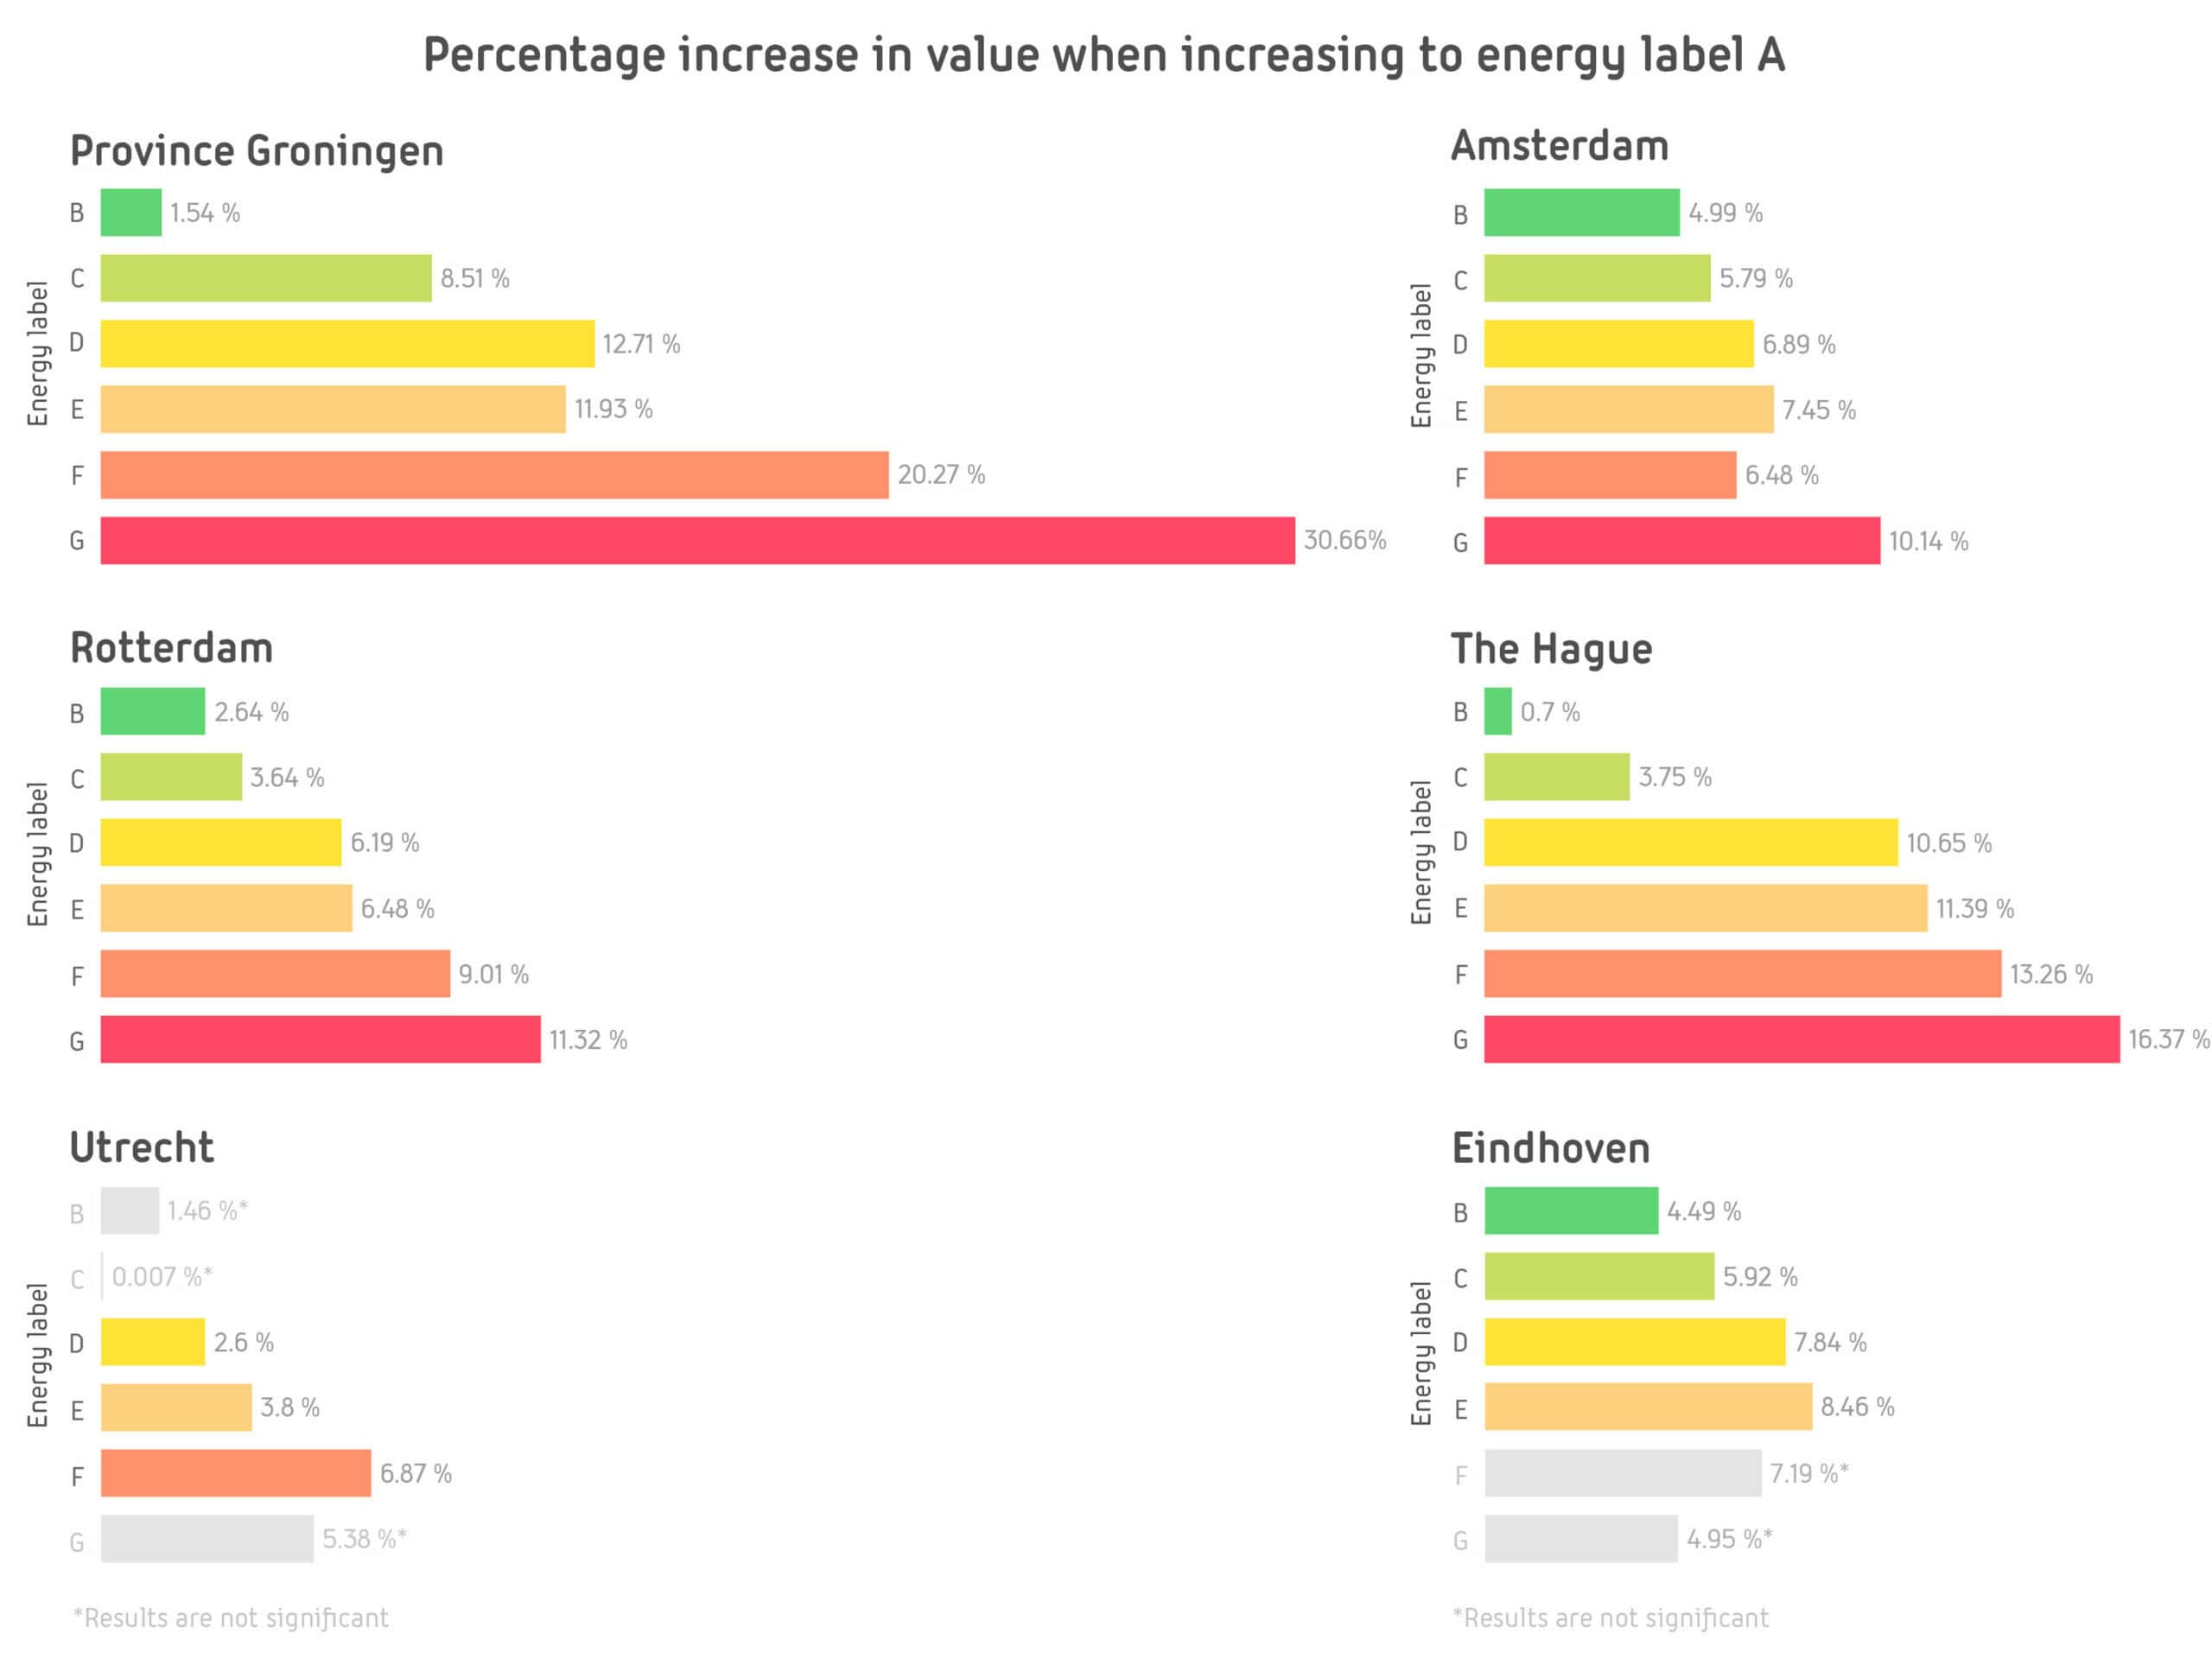
Our research shows that the greatest effects take place outside the major cities, especially in rural areas. In the province of Groningen, the price increase can even reach up to 30.66 %.
Besides, it appears that the five biggest cities in the Netherlands differ from one another. For instance, improving the sustainability of energy label B to A has the biggest impact on the property value in Amsterdam and Eindhoven (+ 4.99 % and + 4,49 %), especially. In The Hague we see a modest increase in value of 0.7 %.

