
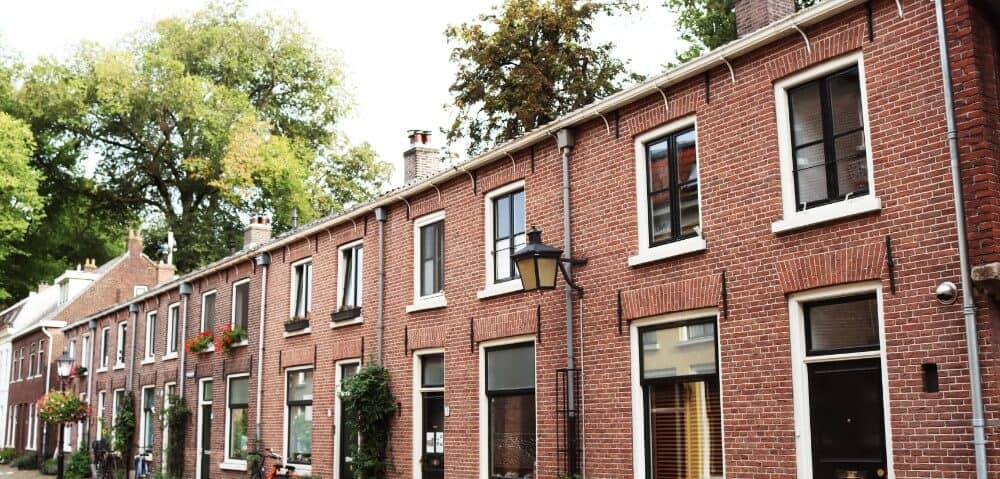
The Dutch housing market is overheated. There are fewer houses for sale while prices are rising and the average selling time is shortening. As a result, buyers are willing to pay more and more. The average amount that was overbid in 2021 even increased by 277%!
Our database shows that 127,487 houses were sold in 2021. A decrease of 5% compared to the previous year (133,828) when the Netherlands was already struggling with a housing crisis. Luke Liplijn, CEO Matrixian Group, calls it a ‘worrying trend’, as it makes finding a suitable home even more difficult.
The decreasing number of sales may well be due to the increasing housing prices. The average sales price in 2021 was € 399,684. That is an increase of 16% compared to 2020 (€ 346,005) and 26% compared to 2019 (€ 315,997). This makes homeowners think twice before putting their house up for sale, as it is uncertain whether they will find a new suitable house afterwards…

Curious how our real estate data can optimize your business results?
Besides the increasing shortages on the market, houses are also sold faster. This can be seen in the enormously shortened selling time, meaning the number of days that a house is for sale. In 2021, the average selling time only counted 41 days, a 30% decrease compared to 2020 (58 days) and 45% decrease compared 2019 (73 days).

The madness in the Dutch housing market translates into rising amounts that are being outbid. In 2021, this rose from an average of € 8,425 in January to an average of € 31,728 in November, an increase of 277%. For populair houses and areas, this amount even rose to half a ton. On average, the most overbids were in Haarlem (€ 49,919), Utrecht (€ 49,443) and Heemstede (€ 44,387).
")
Overbids per municipality
In the interactive map below you can see how much was outbid on average per municipality in 2021.
Please note: all figures refer to the period January to November. In addition, foreclosure sales and other outliers that cast doubt on the representativeness were not included in the analysis.