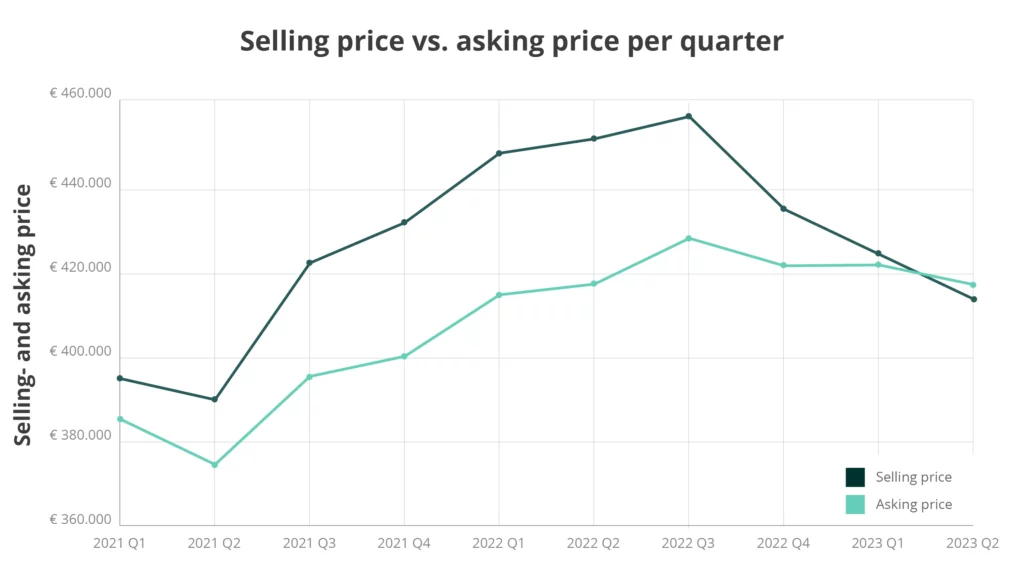
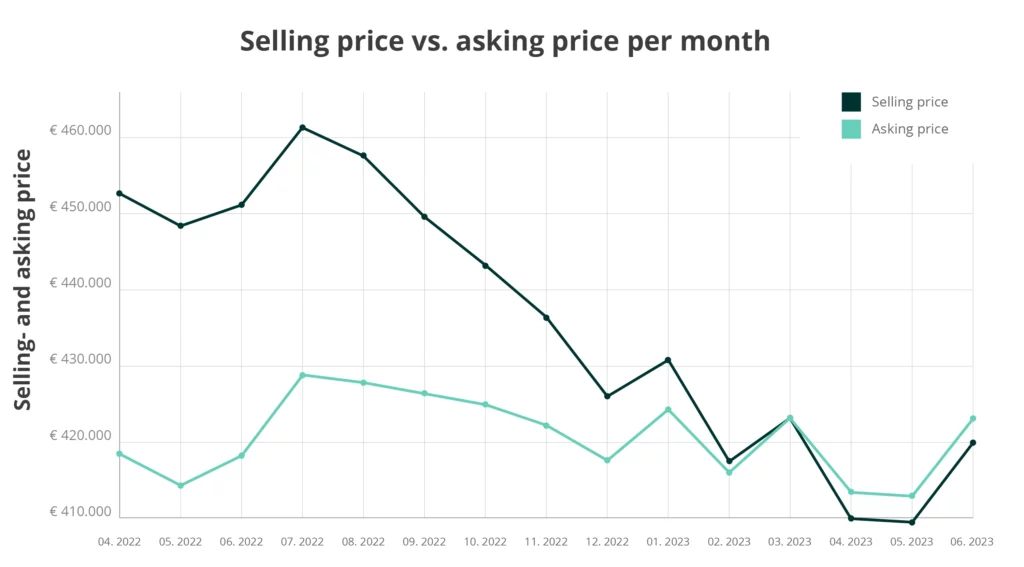
As the Dutch real estate market continues to cool down, an interesting trend is emerging that catches our attention: the average selling price has dropped below the average asking price. Our most recent quarterly data shows this shift, marking a turning point where overbidding is officially making way for the emerging trend of underbidding.
Price development
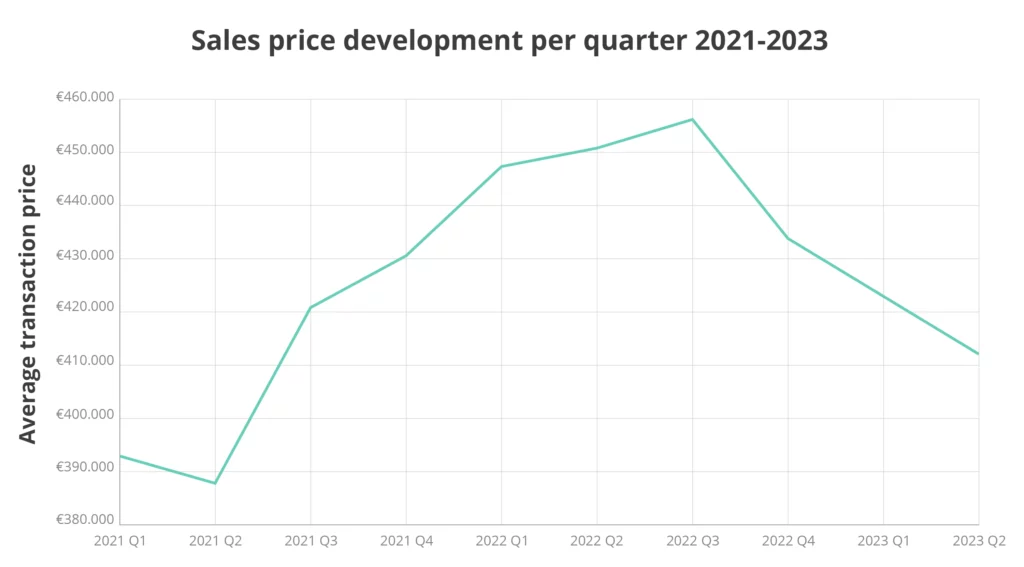
Our new quarterly figures reveal that the average selling price has once again decreased. In Q2 2023, the average selling price was €413,206, representing a decrease of 2.5% compared to the previous quarter (€424,073). Despite being the third consecutive quarterly decline, prices remain relatively high. As a result, we can only describe the Dutch housing market as continuing to cool down.
Number of houses sold
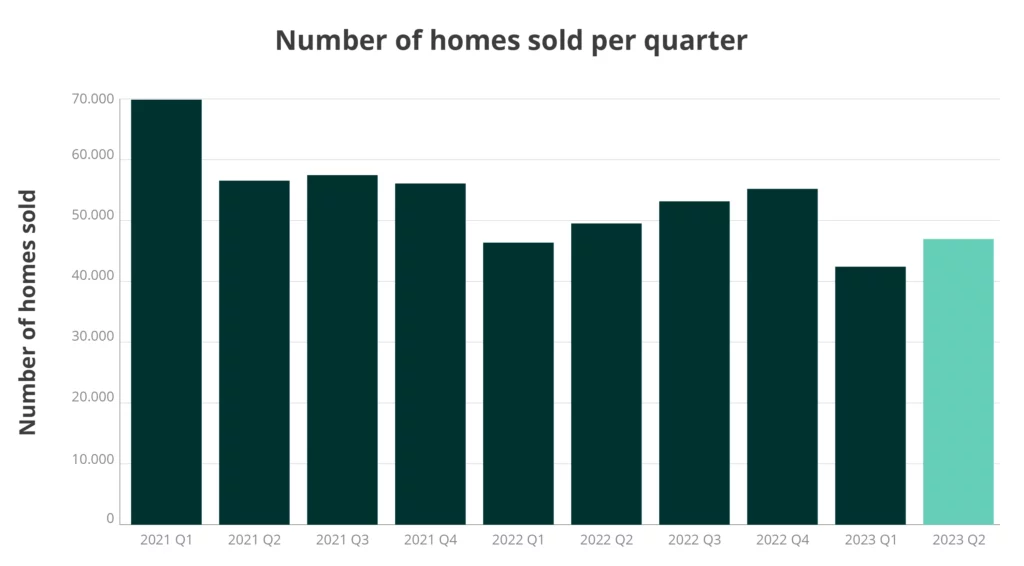
When analyzing the number of sold homes, a modest increase is noticeable. Compared to the first quarter of this year, which experienced a decline of approximately 20% with 42,329 sold homes, the second quarter shows an upward trend. The number of sold homes has grown to 46,866, indicating an increase of 10.72% compared to Q1 2023.
Average over- and underbidding
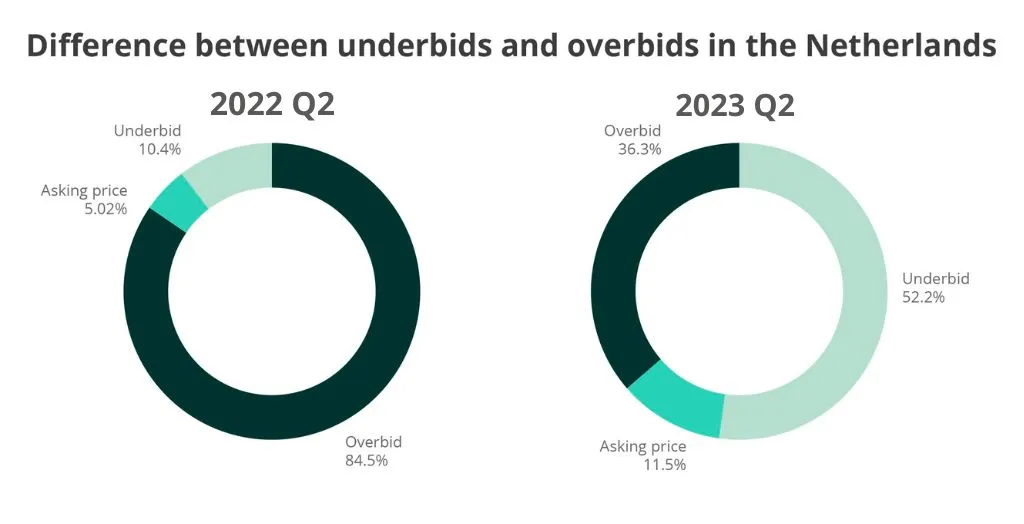
The most remarkable development concerns the rise of underbidding. While this was a rarity just a year ago, we now observe a clear shift taking place. The second quarter of 2022 demonstrated that in 10.4% of cases, a house was purchased below the asking price. This percentage has increased to 52.2% in Q2 2023, marking a significant turning point. For the first time in a very long time, we are witnessing the majority of homes being sold below the asking price, indicating a definitive shift from the practice of overbidding to an emerging trend of underbidding in the Dutch housing market.
Curious about a specific insight into the Dutch housing market?
We have visualized the most crucial housing market data in our Housing Analytics tool. This tool provides you with monthly insights into price development, over- and underbidding, and the average time to sel datal. You can use this tool for free via the Matrixian platform.
Disclaimer: All figures pertain to the private housing market. Additionally, foreclosure sales and other outliers that cast doubt on representativeness have not been included in the analysis.
